
LP Profits: Staying "In-Range" on Uniswap v3
How long does the price remain within a given range?

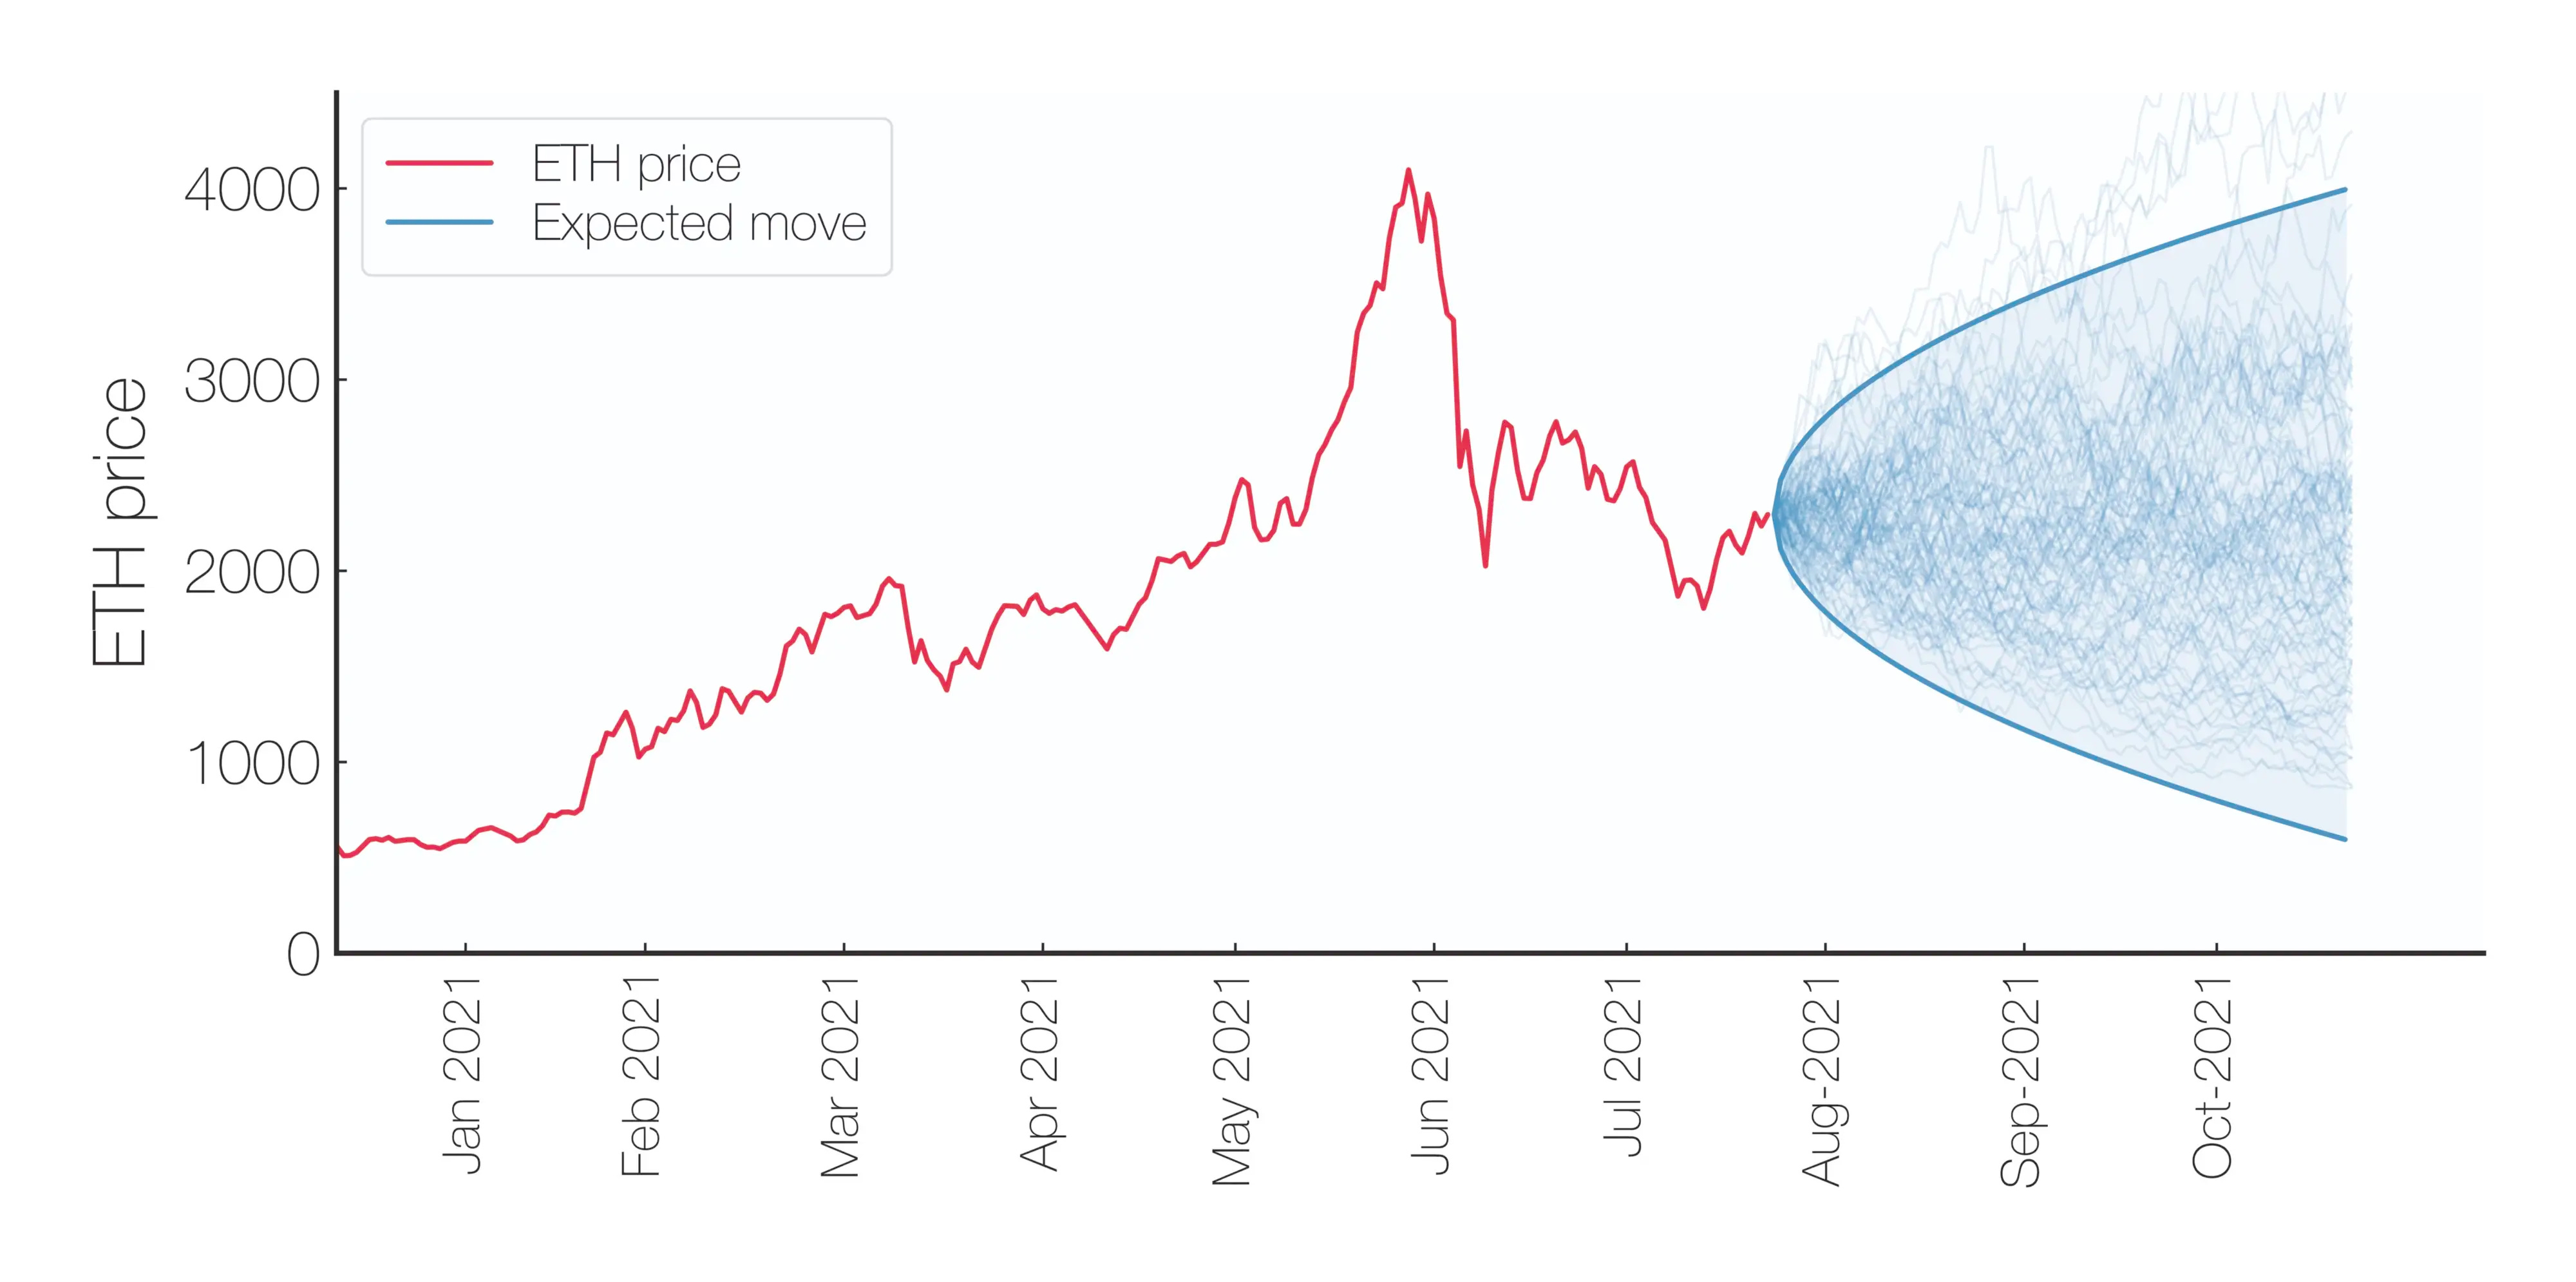
Liquidity provider positions in UniV3 only collect fees when the price is within that position's range. How long does the price remain within a given range? Let's find out!
🧵Caution: contains math 🤓

We will consider positions centered at the current price at time T=0 and monitor how long it takes the price to move a certain number of ticks up or down. In the example below, a position is minted on Jan. 1st 2022 and the price crossed ±2%, ±3%, ±5%, and ±10% in <6 days.

Waiting for the price to move even more, from ±50% to ±300%, it now takes more than 5 months for the price to drift by 11,000 ticks (the ETH price did go down by 3x YTD in May 2022). What's the relationship between the range and the first exit time? Let's look closer 👇

While crossing times do seem to converge for short exit times (see 10, 20, 30bps), it turns out that the average waiting time scales as the square of the range h:
I'm deriving why this relationship exists based on work by Andersen 2008 and @SinclairEuan 2014.


This h^2 law is a consequence of the price *ticks* following a Brownian Motion with normally distributed steps: in a BM, the average displacement after a time t scales as σ*t^2, where σ=volatility. This relationship can be inverted to estimate σ from average crossing times!
Can we use those first exit times to derive a "per tx" volatility? Kind of! 👇 Per tx data is very noisy (blue dots), but using the average over 10,000 tx reveals known volatile periods like Luna/3AC/FTX collapses, or macro events like the Merge and the start of the Ukraine war.

Key insights:
The average time spent within a range ±h scales as
(h/σ)^2E[first exit time]can be used to develop resilient and efficient volatility estimators (when on-chainσFTE?)The volatility calculation in the ETH-USDC pool can highlight volatile macro events
Caveats/Questions:
Do this still hold if price ticks are not a Brownian motion (see quoted thread)
What about 30bps and 100bps pools?
Should the range be adjusted for different volatility environments?
What's the optimal range for a given
σ?

Comment below with questions! 🤝
Like & Retweet & follow @Panoptic_xyz for more #ResearchBites and key updates!
👉Check out our GitHub repo
This content is for educational purposes only and should not be relied upon as financial advice.